Test in production without watermarks.
Works wherever you need it to.
Get 30 days of fully functional product.
Have it up and running in minutes.
Full access to our support engineering team during your product trial
HoloViews is a flexible Python library that makes data visualization real and easy. Through tight integration within the scientific computing stack, it helps users create supple visualizations with very few lines of code in support of backends such as Matplotlib, Bokeh, or Plotly. The developers aimed to develop Holoviews so you can stop plotting your data manually. It is easy to create interactive, highly customizable visualizations that will fit seamlessly into data analysis workflows.
IronPDF is a Python library used to create, edit, and manipulate PDF documents. It allows for HTML to PDF conversions, content edits, implementation of security, and addition of annotation and forms. When you plug HoloViews in with IronPDF, you are just a step away from taking insightful and interactive data plots and embedding them in professional PDF reports that are generated using IronPDF.
This integration particularly benefits data analysts, scientists, business professionals, and those who need to communicate their analysis findings effectively and clearly.
The Python module, HoloViews, was developed with the ease and elegance of data visualization in mind. It puts forward declarative, high-level terms in such a way that users need not bother about how things will be implemented, but concentrate on what they want to visualize. HoloViews is flexible for any kind of data type and structure; it integrates easily with the scientific computing stack and other libraries like Pandas, Dask, or XArray.
This is owed to the fact that it supports several charting back-ends, like Matplotlib, Bokeh, and Plotly, in a way that makes it easy to change between several visualization libraries. Holoviews also has advantages in exploratory data analyses when creating interactive plots to annotate your data.
This is what HoloViews does: abstracting away all problems of data visualization so that users can turn the massive amount of information at their disposal into beautiful, meaningful images with little or no coding. In this way, it has become one of the most critical tools available for a data scientist or analyst.
The reason HoloViews is strong at supporting visualizations is that it embeds the following functionalities, among others:
Declaration of syntax: HoloViews uses high-level declarative syntax, allowing users to easily specify exactly what they want to see, making the creation of complex visualizations straightforward.
Native Integration: It natively supports a wide variety of data types and structures out-of-the-box, thanks to tight integration with libraries within the scientific computing stack like Pandas, Dask, XArray, and more.
External Library Support: It supports a range of libraries, including Matplotlib, Bokeh, and Plotly. This flexibility allows users to switch between multiple visualization libraries without changing a single line of code.
Interactivity: HoloViews provides interactive plots for dynamic visualization, enabling users to explore and interpret data interactively.
Extensibility: It offers a rich set of options for customizing visualizations and supports numerous backends, allowing users to extend and fine-tune their visualizations as needed.
Ease of use: The high-level API of HoloViews reduces the amount of code required to create visualizations of large datasets, allowing users to focus more on data analysis rather than the intricacies of charting.
Composability: HoloViews enables the creation of complex, rich charts focusing on making visualization seamless and simple. Users can effortlessly combine simple components into sophisticated visualizations.
Data Pipelines: HoloViews simplifies the process of building intricate workflows for data processing and presentation.
Rich Ecosystem: As part of the HoloViz ecosystem, HoloViews offers a suite of tools for data visualization and application development. It works well with other robust tools in the ecosystem, such as Panel and Datashader.
Setting up HoloViews is done with the following steps:
Firstly, download and install HoloViews and all its dependencies using the following pip commands:
pip install holoviews
pip install bokeh#import holoviews object
import holoviews as hv
from holoviews import opts
import numpy as np
# Initialize HoloViews with Bokeh backend
hv.extension('bokeh')
# Generate data
x = np.linspace(0, 10, 100)
y = np.sin(x)
# Create plotting your data annotate, with holoviews elements
line_plot = hv.Curve((x, y), label='Sine Wave').opts(
title="Line Plot", xlabel="X-axis", ylabel="Y-axis", color='blue'
)
scatter_plot = hv.Scatter((x, y), label='Scatter Plot').opts(
size=10, color='red', title="Scatter Plot", xlabel="X-axis", ylabel="Y-axis"
)
hist = hv.Hist(np.histogram(y, bins=20)).opts(
title="Histogram", xlabel="Value", ylabel="Frequency", color='green'
)
# Combine the Holoviews plot into a layout
layout = (line_plot + scatter_plot + hist).cols(1)
layout.opts(
opts.Curve(width=400, height=400),
opts.Scatter(width=400, height=400),
opts.Histogram(width=400, height=400)
)
# Display layout
layout
# Save to file
hv.save(layout, 'visualization.html', fmt='html')The code snippet above will generate and customize some of the graphical elements of these data visualizations in HoloViews, and then compose them in a single layout. Do some imports and initiate HoloViews to use the Bokeh backend so that the plots can be interactive. Generate a dataset with NumPy by creating an array of values x and their corresponding sine values y.
This script will produce three plot types: a line plot of a sine wave, a scatter plot with the exact data points, and a histogram of the distribution of sine values. All are customized with a title, axis labeling, and coloring via the `opts` method.
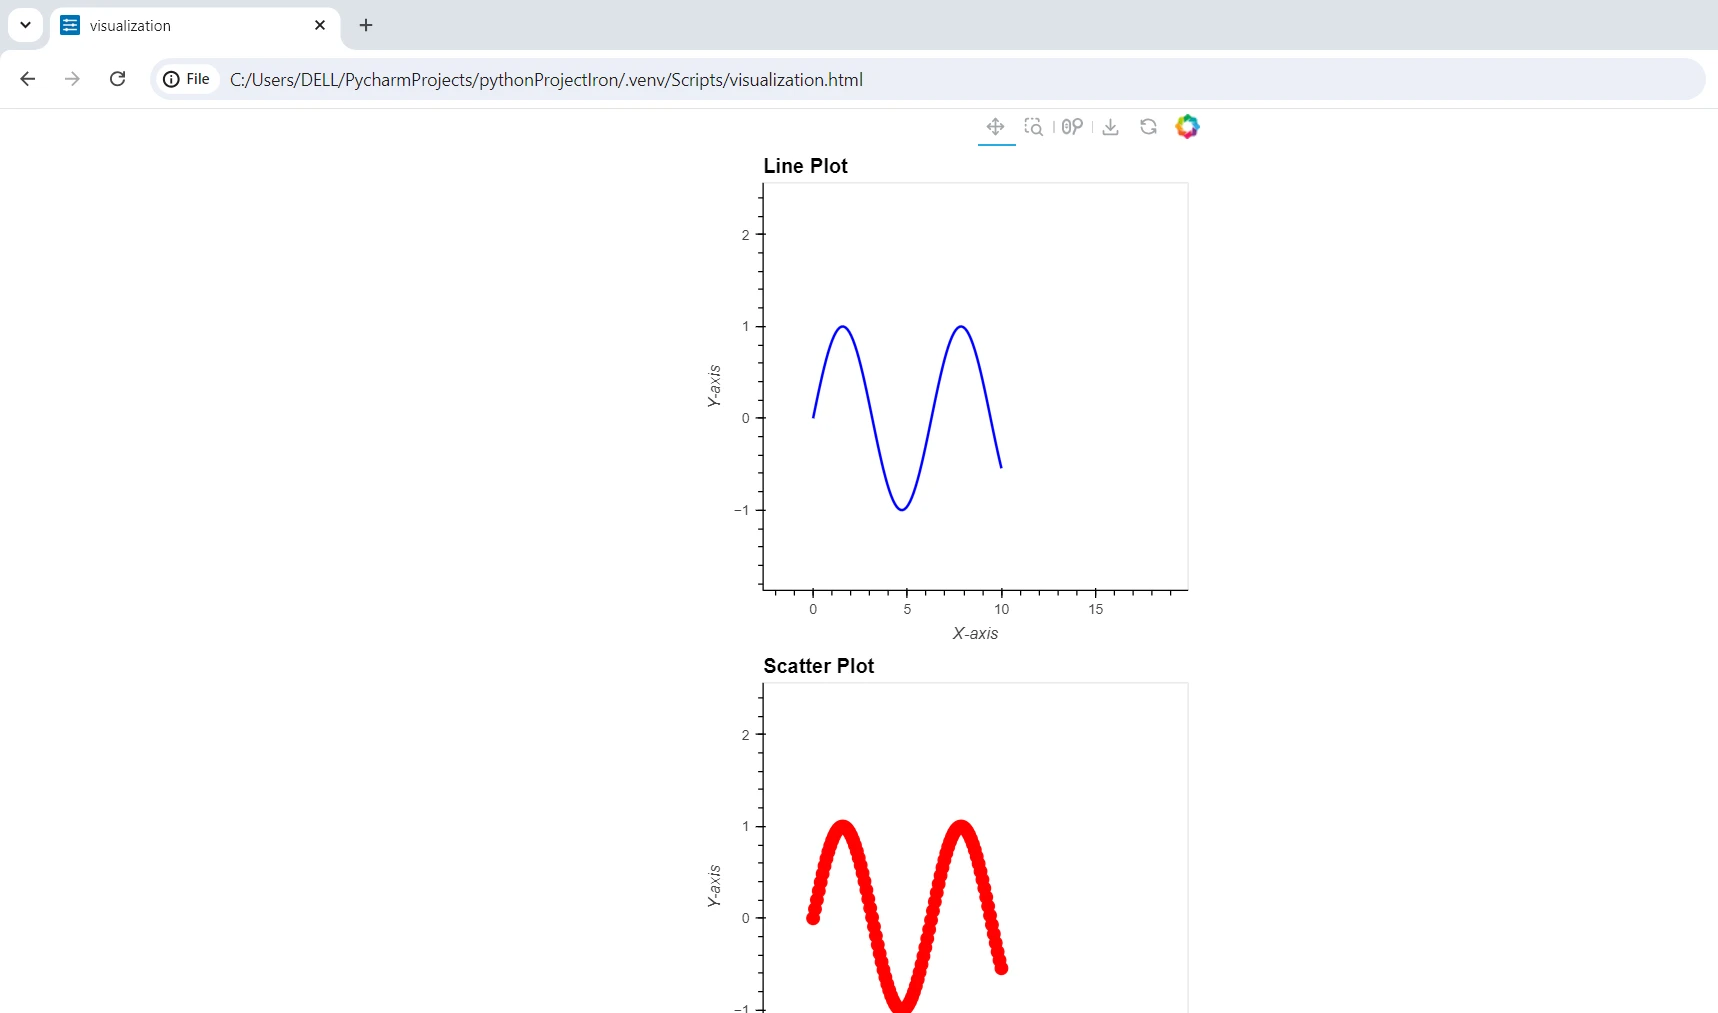
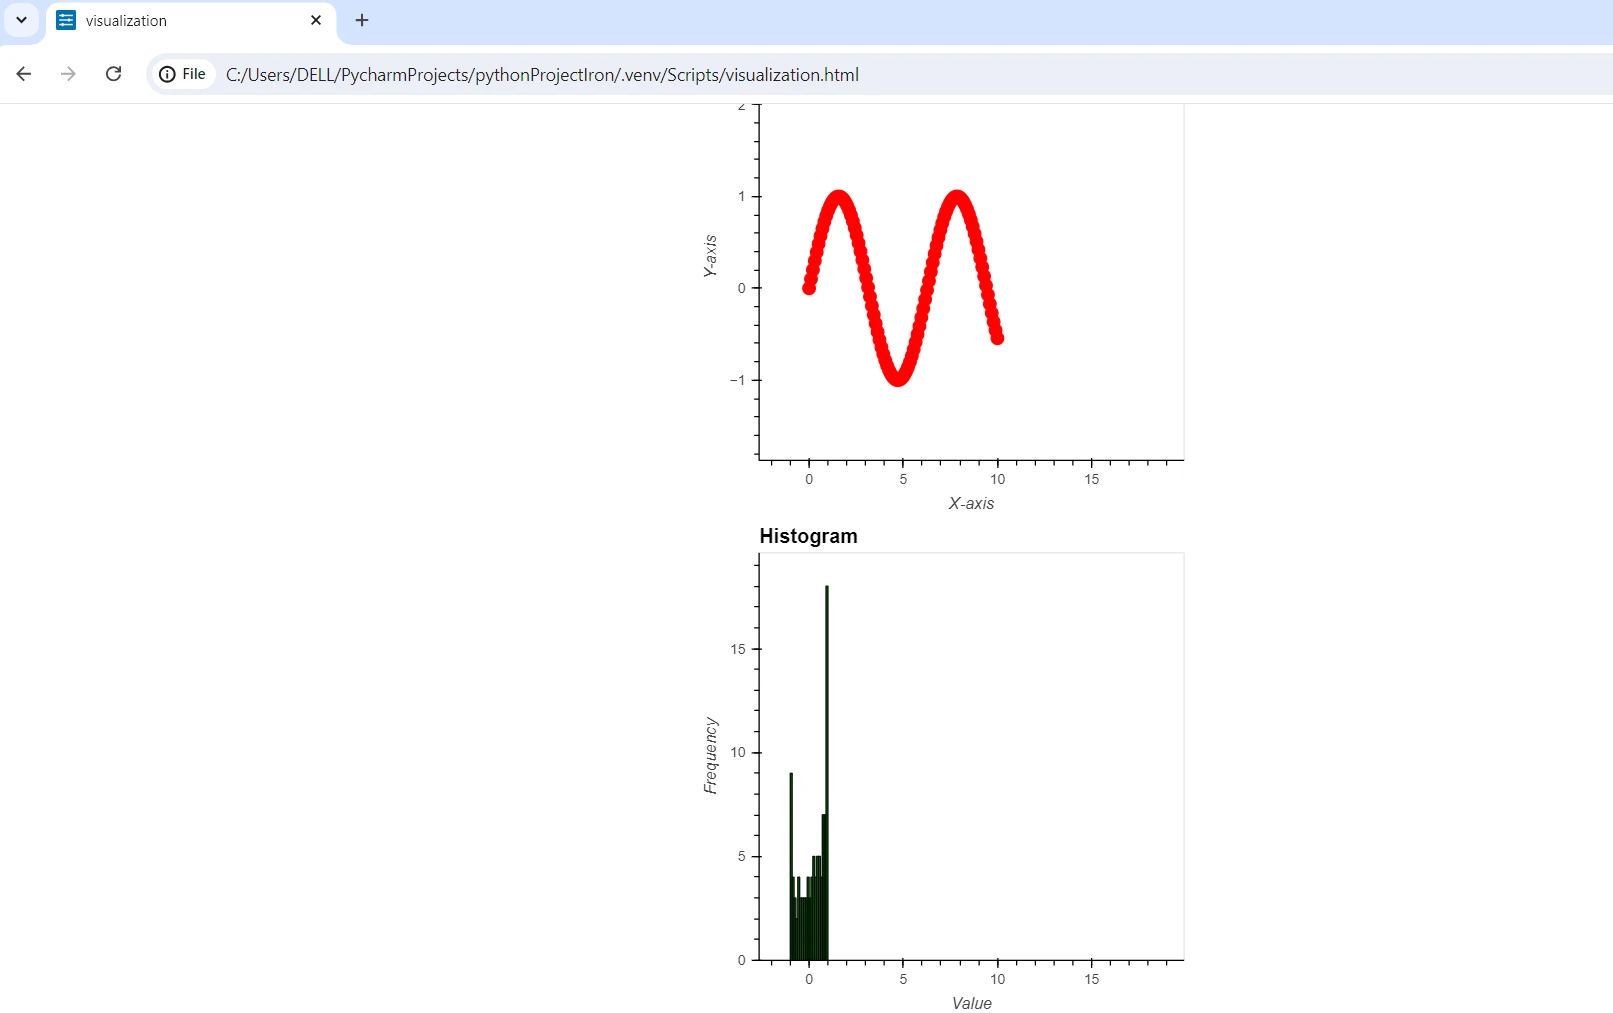
This piles all the plots on top of each other in one column. Finally, we show the visualization's seamless layout and then use hv.save to save it along with its full content in an HTML file named 'visualization.html'. When using HoloViews, the entire process from building to styling and saving an interactive visualization becomes very easy.
You will now learn how to use HoloViews for data visualization and IronPDF to create PDF documents with these visualizations. A set of instructions will guide you through installing these libraries, creating visualizations, and then generating PDFs from these visualizations using HoloViews and IronPDF.
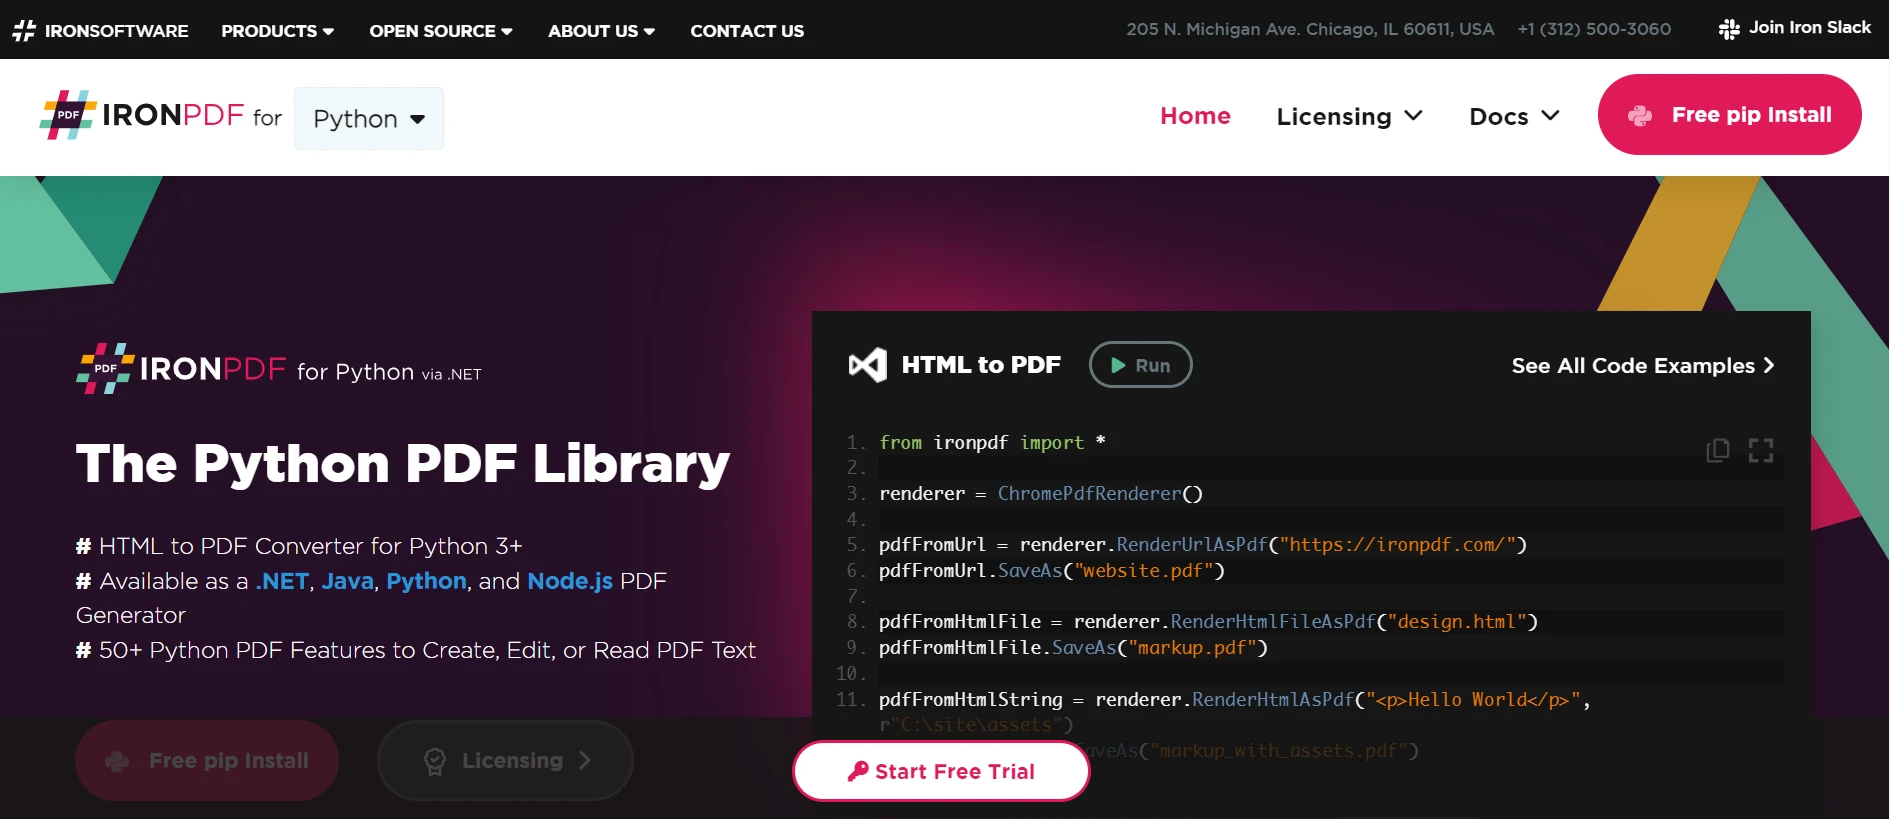
Using the Python module IronPDF, it is possible to accomplish different advanced and programmatic tasks within a PDF document. It is a very robust, full-featured tool that creates, edits, and reads PDFs. Creating documents directly from HTML files helps to restore the usability of any created and altered PDF documents that were previously made.
Greater compatibility and the creation of attractive PDF reports will be achieved when using IronPDF. Applications that depend on dynamically creating and updating PDFs will benefit particularly from this. It is also a library with a vast and comprehensible documentation page with extensive examples to help you along the way.
Using IronPDF documentation, any HTML data can be generated into a PDF document in just a moment. One can leverage the vast majority of the latest elements that are now a part of HTML5, CSS3, and Javascript to come up with creative and captivating PDF publications straight from web material.
You can, with a little computer programming, programmatically create new PDF documents that include text, graphics, and tables, amongst many other features. You may also open pre-prepared documents in your browser in advance with IronPDF and thereafter edit them further. Content can always be added to, changed, or removed from a PDF document.
Complex layouts with multiple fonts, colors, and other design elements are allowed because PDFs contain an implicit style. Now, suppose that there is dynamic content within a PDF that could change. Quite noticeably, it is much easier to render data in the default HTML format and not in JavaScript.
You can install the IronPDF library via pip with the following commands:
pip install ironpdfHere's an example of how to use HoloViews to build simple visualizations.
import holoviews as hv
from holoviews import opts
import numpy as np
from ironpdf import *     import warnings
# Suppress warnings
warnings.filterwarnings('ignore')
# Set IronPDF license key (replace with your actual key)
License.LicenseKey = "";
# Initialize HoloViews with Bokeh backend
hv.extension('bokeh')
# Generate data
x = np.linspace(0, 10, 100)
y = np.sin(x)
# holoviews objects
line_plot = hv.Curve((x, y), label='Sine Wave').opts(
    title="Line Plot", xlabel="X-axis", ylabel="Y-axis", color='blue'
)
scatter_plot = hv.Scatter((x, y), label='Scatter Plot').opts(
    size=10, color='red', title="Scatter Plot", xlabel="X-axis", ylabel="Y-axis"
)
# Combine plots into a layout
layout = (line_plot + scatter_plot ).cols(1)
layout.opts(
    opts.Curve(width=400, height=400),
    opts.Scatter(width=400, height=400),
    opts.Histogram(width=400, height=400)
)
# Save to file
hv.save(layout, 'visualization.html', fmt='html')
# Convert the HTML file to PDF
pdf_file_path = 'document.pdf'
html_to_pdf = ChromePdfRenderer()
pdf_document = html_to_pdf.RenderHtmlFileAsPdf('visualization.html')
# Save the PDF
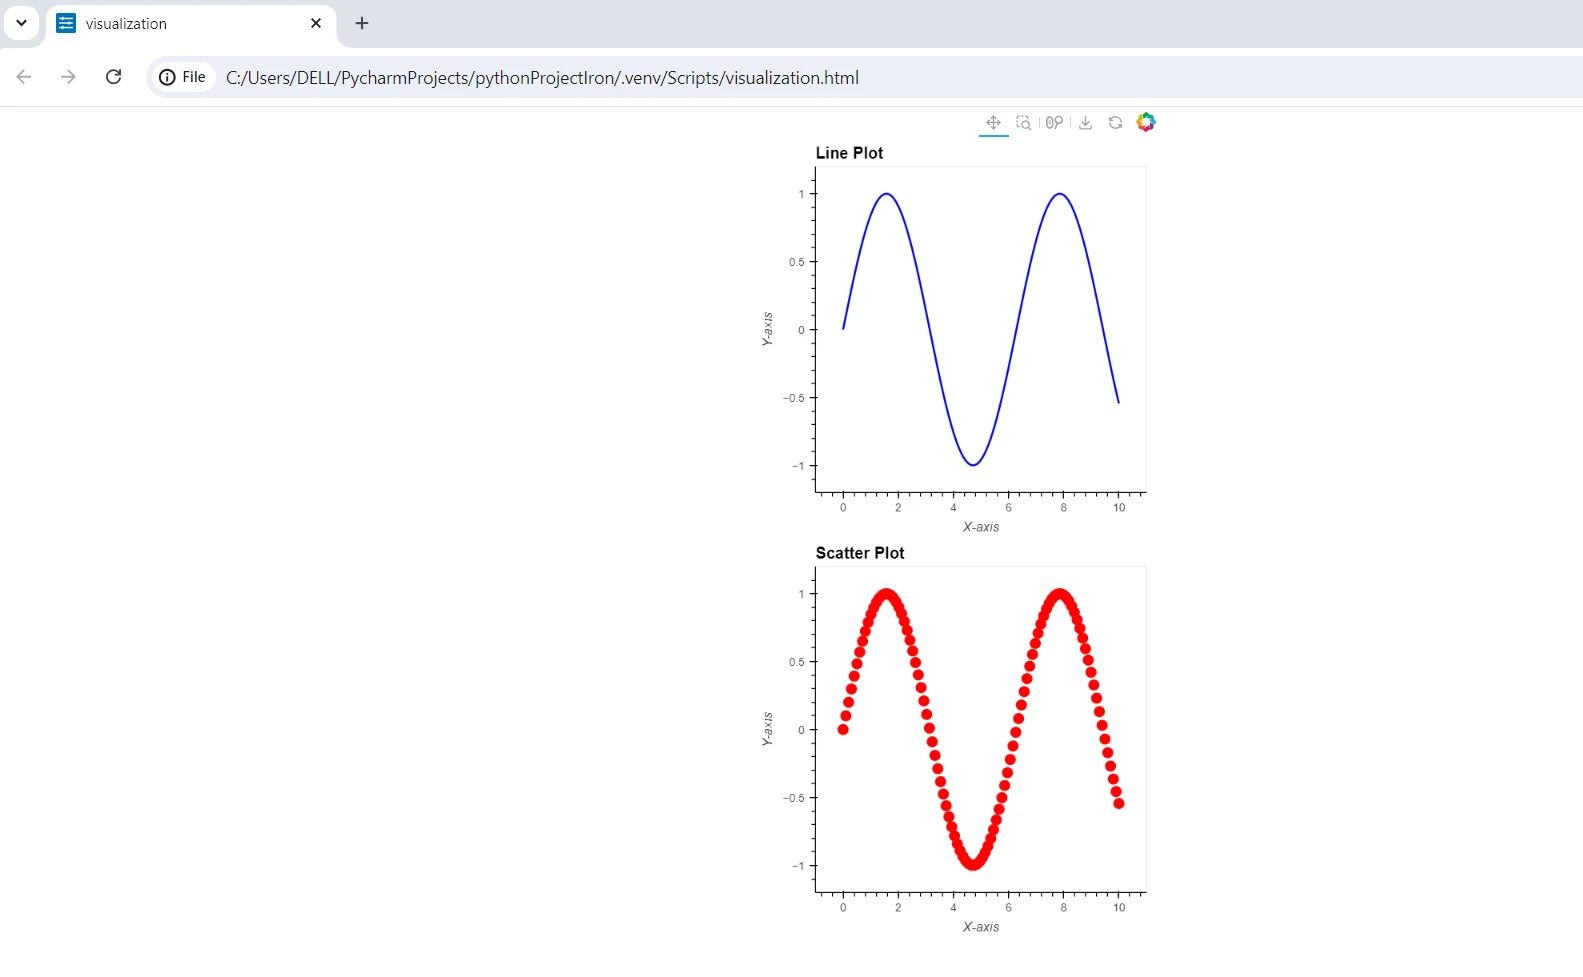
pdf_document.SaveAs(pdf_file_path)The above code integrates IronPDF with HoloViews in creating visualizations and then converts them to PDF documents. It starts by silencing the warnings and importing the required modules: ironpdf for rendering PDFs, numpy for the generation of some data to plot, and holoviews for data visualization. Set up the license key for IronPDF in Permission. Initialize HoloViews with a Bokeh backend to be able to create an interactive visualization.
An array x ranging from 0 to 10, with 100 points, is created using NumPy; another variable y is the sine of x. A line plot and a scatter plot are created with options including color names, Axis labels, and such. 'line_plot + scatter_plot' does this through merging these plots into one in column form (.cols(1)), saved, with hv.save(), as an HTML file entitled "visualization.html". IronPDF subsequently converts 'visualization.html' into a PDF document.
Use the function ChromePdfRenderer().RenderHtmlFileAsPdf() and then pdf_document.SaveAs() to save it as 'document.pdf.' Clearly, this process shows how to combine HoloViews and IronPDF, converting interactive visualizations into a professional PDF report.
In summary, HoloViews with IronPDF makes for a robust solution to generate and distribute data-driven visualizations in the form of PDF documents. Taking advantage of its smooth interface with plotting tools such as Bokeh and Matplotlib, HoloViews eases the process of creating interactive and customized plots. In such a case, any jobs involving data analysis can easily be translated into instant informative visual reports. IronPDF complements these capabilities with equally powerful tools to change such visualizations into high-quality PDF document types.
When combined, they empower users to effectively visualize data and work out the means of sharing or presenting the findings in one understandable format to all. By making it easier to get from data visualization all the way to action, HoloViews and IronPDF further enhance productivity and facilitate communication across myriad scenarios, such as academic research, business presentations, data-driven storytelling, and even interactive visualization.
It can even handle very advanced solutions, since IronPDF can be combined with other Iron Software and in just a few days, you'll see that the $749 license fee is well worth it.