Test in production without watermarks.
Works wherever you need it to.
Get 30 days of fully functional product.
Have it up and running in minutes.
Full access to our support engineering team during your product trial
Introducing Dottrace .NET Core, a powerful tool in the .NET ecosystem that serves as an essential .NET tool for performance profiling. As a .NET performance profiler, the .NET trace tool enables developers to capture detailed trace files that provide insights into runtime events of a running process. This tool is indispensable for optimizing applications built on the .NET framework.
Whether you're conducting unit testing or integrating continuous integration builds, Dottrace allows you to monitor and analyze the performance of your applications effectively. By leveraging this tool, you can gain a deeper understanding of your application's behavior, ensuring peak performance and reliability.
IronPDF is a comprehensive library for working with PDFs in .NET applications. It allows you to create, edit, and extract content from PDF files. IronPDF supports features like HTML to PDF conversion, PDF merging, and splitting. This library is a valuable tool for any application that needs to generate or manipulate PDF documents. This article will utilize this library in conjunction with Dottrace to express a real-life application of Dottrace and IronPDF's effectiveness.
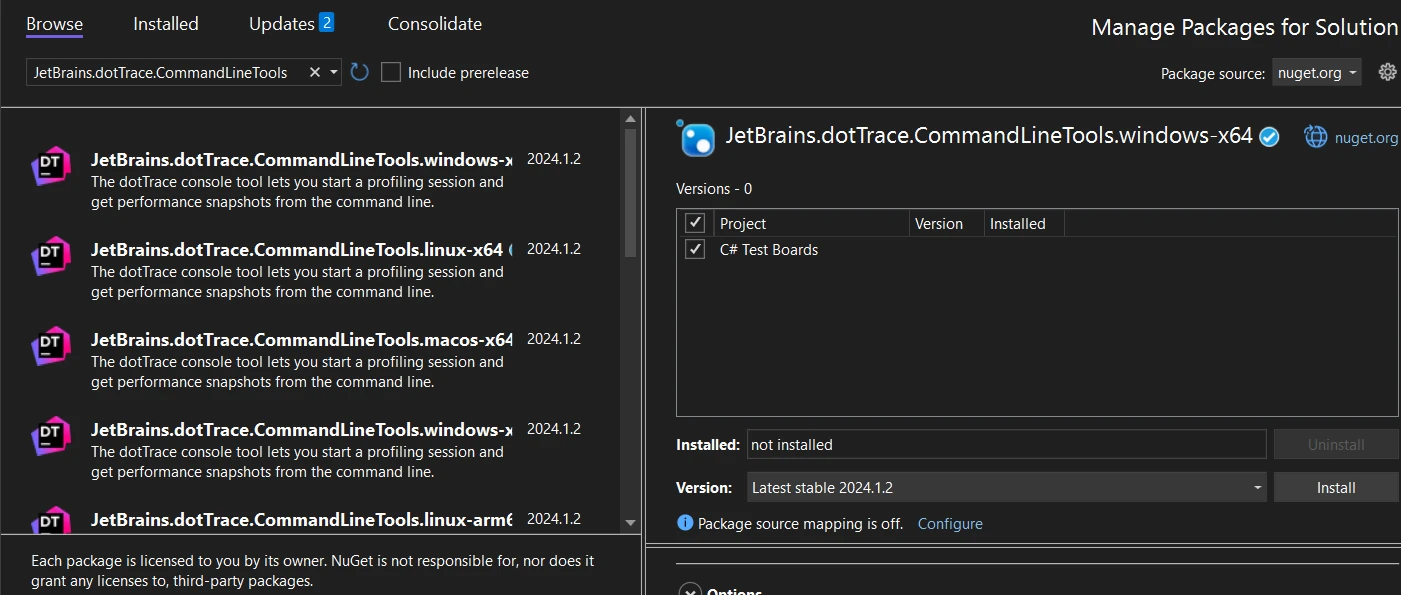
First, you need to install Dottrace .NET Core using NuGet. Open Visual Studio and follow these steps:
DottraceExample and click Create.JetBrains.dotTrace.CommandLineTools.This installs Dottrace as a dependency in your project.

Let's create a basic console application to profile. Replace the code in Program.cs with the following:
using System;
using System.Threading;
class Program
{
    static void Main(string[] args)
    {
        Console.WriteLine("Starting application...");
        Thread.Sleep(5000); // Simulating a time-consuming operation
        Console.WriteLine("Application finished.");
    }
}
using System;
using System.Threading;
class Program
{
static void Main(string[] args)
{
Console.WriteLine("Starting application...");
Thread.Sleep(5000); // Simulating a time-consuming operation
Console.WriteLine("Application finished.");
}
}Imports System
Imports System.Threading
Friend Class Program
Shared Sub Main(ByVal args() As String)
Console.WriteLine("Starting application...")
Thread.Sleep(5000) ' Simulating a time-consuming operation
Console.WriteLine("Application finished.")
End Sub
End ClassBuild and run your application by pressing F5. Once the application is running, you will need its process ID for profiling. You can find the process ID using Visual Studio's Diagnostics Tools window or by checking the Task Manager.
To profile your application using Dottrace, open a terminal window or the Package Manager Console in Visual Studio and run:
dotnet trace collect --process-id <your-process-id> --output trace.nettraceReplace <your-process-id> with the actual process ID of your running application.
After your application finishes, you will have a trace.nettrace file. This file contains all the profiling data collected during the application's execution. You can analyze this file in Visual Studio. Follow these steps:
trace.nettrace file and click Open.Visual Studio will display detailed performance data, allowing you to identify and fix performance bottlenecks.
Now that you have set up Dottrace and created a basic profiling example, you can move on to implementing more advanced features.
One of the key features of Dottrace .NET Core is analyzing CPU usage. This helps you identify which parts of your code consume the most CPU resources. Here's how to do it:
First, start your application in Visual Studio. Then, in the terminal or Package Manager Console, run:
dotnet trace collect --process-id <your-process-id> --output cpu_usage.nettraceReplace <your-process-id> with the actual process ID of your application. Once the profiling session is complete, open the cpu_usage.nettrace file in Visual Studio:
using System;
using System.Diagnostics;
class Program
{
    static void Main(string[] args)
    {
        var sw = new Stopwatch();
        sw.Start();
        // Simulate a CPU-intensive operation
        for (int i = 0; i < 1000000000; i++) { }
        sw.Stop();
        Console.WriteLine($"Elapsed Time: {sw.ElapsedMilliseconds} ms");
    }
}
using System;
using System.Diagnostics;
class Program
{
static void Main(string[] args)
{
var sw = new Stopwatch();
sw.Start();
// Simulate a CPU-intensive operation
for (int i = 0; i < 1000000000; i++) { }
sw.Stop();
Console.WriteLine($"Elapsed Time: {sw.ElapsedMilliseconds} ms");
}
}Imports System
Imports System.Diagnostics
Friend Class Program
Shared Sub Main(ByVal args() As String)
Dim sw = New Stopwatch()
sw.Start()
' Simulate a CPU-intensive operation
For i As Integer = 0 To 999999999
Next i
sw.Stop()
Console.WriteLine($"Elapsed Time: {sw.ElapsedMilliseconds} ms")
End Sub
End ClassThis code simulates a CPU-intensive operation. When you analyze the cpu_usage.nettrace file, you will see that the loop takes a significant amount of CPU time.
Dottrace .NET Core can also help you monitor memory allocation in your application. This is crucial for identifying memory leaks and optimizing memory usage.
Run your application and collect memory allocation data:
dotnet trace collect --process-id <your-process-id> --output memory_allocation.nettraceAfter the session, open the memory_allocation.nettrace file in Visual Studio:
using System;
class Program
{
    static void Main(string[] args)
    {
        for (int i = 0; i < 10000; i++)
        {
            var data = new byte[1024]; // Allocate 1KB
        }
        Console.WriteLine("Memory allocation completed.");
    }
}
using System;
class Program
{
static void Main(string[] args)
{
for (int i = 0; i < 10000; i++)
{
var data = new byte[1024]; // Allocate 1KB
}
Console.WriteLine("Memory allocation completed.");
}
}Imports System
Friend Class Program
Shared Sub Main(ByVal args() As String)
For i As Integer = 0 To 9999
Dim data = New Byte(1023){} ' Allocate 1KB
Next i
Console.WriteLine("Memory allocation completed.")
End Sub
End ClassThis code allocates memory in a loop. Analyzing the memory_allocation.nettrace file will show how much memory is allocated and where it happens in your code.
Profiling I/O operations is another essential feature. It helps you understand the performance impact of reading from and writing to files.
Start your application and collect I/O data:
dotnet trace collect --process-id <your-process-id> --output io_operations.nettraceOpen the io_operations.nettrace file in Visual Studio for analysis:
using System;
using System.IO;
class Program
{
    static void Main(string[] args)
    {
        var filePath = "test.txt";
        // Write to file
        using (var writer = new StreamWriter(filePath))
        {
            for (int i = 0; i < 1000; i++)
            {
                writer.WriteLine("This is a test line.");
            }
        }
        // Read from file
        using (var reader = new StreamReader(filePath))
        {
            while (reader.ReadLine() != null) { }
        }
        Console.WriteLine("I/O operations completed.");
    }
}
using System;
using System.IO;
class Program
{
static void Main(string[] args)
{
var filePath = "test.txt";
// Write to file
using (var writer = new StreamWriter(filePath))
{
for (int i = 0; i < 1000; i++)
{
writer.WriteLine("This is a test line.");
}
}
// Read from file
using (var reader = new StreamReader(filePath))
{
while (reader.ReadLine() != null) { }
}
Console.WriteLine("I/O operations completed.");
}
}Imports System
Imports System.IO
Friend Class Program
Shared Sub Main(ByVal args() As String)
Dim filePath = "test.txt"
' Write to file
Using writer = New StreamWriter(filePath)
For i As Integer = 0 To 999
writer.WriteLine("This is a test line.")
Next i
End Using
' Read from file
Using reader = New StreamReader(filePath)
Do While reader.ReadLine() IsNot Nothing
Loop
End Using
Console.WriteLine("I/O operations completed.")
End Sub
End ClassThis code writes to and reads from a file. Analyzing the io_operations.nettrace file will reveal the time spent on I/O operations.
Identifying performance bottlenecks is one of the main purposes of using Dottrace. By analyzing the collected trace files, you can pinpoint the slow parts of your code.
Start your application and collect performance data:
dotnet trace collect --process-id <your-process-id> --output performance_bottlenecks.nettraceOpen the performance_bottlenecks.nettrace file in Visual Studio:
using System;
using System.Threading;
class Program
{
    static void Main(string[] args)
    {
        Console.WriteLine("Starting application...");
        // Simulate a time-consuming operation
        Thread.Sleep(5000);
        Console.WriteLine("Application finished.");
    }
}
using System;
using System.Threading;
class Program
{
static void Main(string[] args)
{
Console.WriteLine("Starting application...");
// Simulate a time-consuming operation
Thread.Sleep(5000);
Console.WriteLine("Application finished.");
}
}Imports System
Imports System.Threading
Friend Class Program
Shared Sub Main(ByVal args() As String)
Console.WriteLine("Starting application...")
' Simulate a time-consuming operation
Thread.Sleep(5000)
Console.WriteLine("Application finished.")
End Sub
End ClassThis code simulates a delay in the application. Analyzing the performance_bottlenecks.nettrace file will show where the most time is spent, helping you optimize those parts.
These examples cover key features of Dottrace .NET Core. You can now analyze CPU usage, monitor memory allocation, profile I/O operations, identify performance bottlenecks, and profile in production environments. Each feature helps you optimize and improve your .NET Core applications.

IronPDF is a powerful .NET library that lets you generate, edit, and manage PDFs easily within your C# applications. Whether you need to create new PDFs from scratch, convert HTML to PDF, or manipulate existing PDFs, IronPDF provides a rich set of features to accomplish these tasks efficiently. It's beneficial for applications that require PDF generation and processing, such as reporting systems, document management solutions, and web applications.
Consider a scenario where you have a web application that generates PDF reports for users. By using Dottrace, you can track the performance of the PDF generation process, identify performance issues using the trace file, and make improvements to enhance the user experience. This integration is particularly valuable for applications that handle large volumes of PDF documents or require high-performance processing.
Below is a complete code example that demonstrates how to integrate IronPDF with Dottrace. This example creates a simple HTML to PDF conversion and uses Dottrace to monitor the performance of the operation.
using System;
using IronPdf;
using Microsoft.Diagnostics.Tracing;
using Microsoft.Diagnostics.Tracing.Session;
class Program
{
    static void Main(string[] args)
    {
        // Start tracing session
        using (var session = new TraceEventSession("MySession"))
        {
            session.EnableProvider("Microsoft-Windows-DotNETRuntime");
            // Perform PDF generation
            var pdfDocument = GeneratePdf("Hello, world!");
            // Save the PDF to a file
            pdfDocument.SaveAs("example.pdf");
            // Stop tracing session
            session.Stop();
        }
        Console.WriteLine("PDF generated and performance traced successfully.");
    }
    static PdfDocument GeneratePdf(string htmlContent)
    {
        // Create an instance of the HtmlToPdf renderer
        var renderer = new ChromePdfRenderer();
        // Convert HTML to PDF
        var pdfDocument = renderer.RenderHtmlAsPdf(htmlContent);
        return pdfDocument;
    }
}
using System;
using IronPdf;
using Microsoft.Diagnostics.Tracing;
using Microsoft.Diagnostics.Tracing.Session;
class Program
{
static void Main(string[] args)
{
// Start tracing session
using (var session = new TraceEventSession("MySession"))
{
session.EnableProvider("Microsoft-Windows-DotNETRuntime");
// Perform PDF generation
var pdfDocument = GeneratePdf("Hello, world!");
// Save the PDF to a file
pdfDocument.SaveAs("example.pdf");
// Stop tracing session
session.Stop();
}
Console.WriteLine("PDF generated and performance traced successfully.");
}
static PdfDocument GeneratePdf(string htmlContent)
{
// Create an instance of the HtmlToPdf renderer
var renderer = new ChromePdfRenderer();
// Convert HTML to PDF
var pdfDocument = renderer.RenderHtmlAsPdf(htmlContent);
return pdfDocument;
}
}Imports System
Imports IronPdf
Imports Microsoft.Diagnostics.Tracing
Imports Microsoft.Diagnostics.Tracing.Session
Friend Class Program
Shared Sub Main(ByVal args() As String)
' Start tracing session
Using session = New TraceEventSession("MySession")
session.EnableProvider("Microsoft-Windows-DotNETRuntime")
' Perform PDF generation
Dim pdfDocument = GeneratePdf("Hello, world!")
' Save the PDF to a file
pdfDocument.SaveAs("example.pdf")
' Stop tracing session
session.Stop()
End Using
Console.WriteLine("PDF generated and performance traced successfully.")
End Sub
Private Shared Function GeneratePdf(ByVal htmlContent As String) As PdfDocument
' Create an instance of the HtmlToPdf renderer
Dim renderer = New ChromePdfRenderer()
' Convert HTML to PDF
Dim pdfDocument = renderer.RenderHtmlAsPdf(htmlContent)
Return pdfDocument
End Function
End Class
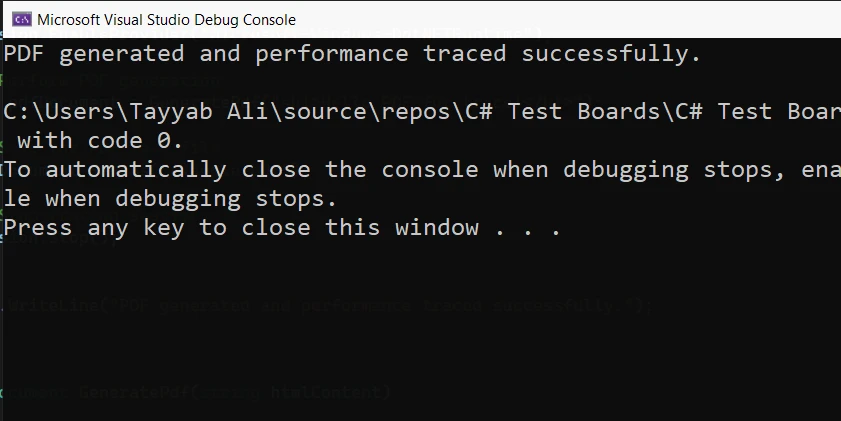
In this example, we start by creating a TraceEventSession to capture performance data using Dottrace. We then generate a PDF from a simple HTML string using IronPDF. After saving the PDF, we stop the tracing session.

This allows us to monitor the performance of the PDF generation process and gather valuable insights into its execution.
Explore the IronPDF Licensing Options page to learn about the available licenses and their respective prices.
By integrating Dottrace with IronPDF, you can significantly enhance the performance and reliability of your PDF generation processes. This integration provides valuable insights into how your application handles PDF tasks, helping you optimize operations and ensure a smooth user experience. IronPDF offers a comprehensive set of features for working with PDFs, making it an essential tool for any .NET developer.
IronPDF offers a free trial, and licenses start from $749, allowing you to evaluate its capabilities before making a purchase. Combining the power of Dottrace and IronPDF can help you create high-performing, efficient applications that meet your users' needs.